Building a Usage Dashboard Without Logging User Data

Users kept asking the same thing. "Is it actually doing anything?" They'd wire their AI assistant up to DataToRAG, kick off a workflow, and have no way to see what happened. Did Gmail even get called? Did a search fail silently? Was the slow response our fault or Anthropic's?
We needed a usage dashboard. But DataToRAG is a multi-tenant MCP gateway. Every user's data flows through the same pipes on its way to Google or Atlassian, so the last thing anyone wants is a "helpful" dashboard that logs their Gmail search terms or the contents of a Jira comment they just drafted.
The first design constraint was easy to name: track behavior, not content.
What we log, and what we refuse to
For every tool call we record six things:
- Tool name (
gmail_search,jira_create_issue) - Connector (
google-workspace,atlassian) - Outcome label (
success,user_error, orserver_error) - Latency in milliseconds
- Response size in bytes
- A redacted error message when something failed
That's the whole row. No arguments. No response body. No q= search query, no message ID, no ticket title, no document contents.
If a call errored with something like "Message 18f3a2c1b not found for user [email protected]", we run that string through a regex redactor before it hits the database. Emails, Google Drive IDs, and long quoted strings all get replaced with [redacted]. The error message is useful because it tells users why something failed. It's not worth storing PII to get there.
The schema lives in a single usage_events table in the same Postgres instance as the rest of the app. No separate analytics warehouse, no third-party event pipeline, no cross-region replication. It's just a table.
Counting what matters
Not every tool call should count equally. We settled on three outcome buckets:
Success. Gateway dispatched the call, upstream API returned 2xx, plugin handed back a normal response. Counted.
User error. Gateway dispatched the call, upstream API returned something the user can fix (404 on a missing message, 400 on bad JQL, 403 on a file the user can't access). Counted. These are legitimate invocations. The system did its job. The user asked for something that doesn't exist.
Server error. Our gateway choked, a plugin threw, or the upstream API had a 5xx outage. Not counted. If we're broken, that's on us. Charging the user (or even showing it in their metrics) is the wrong signal.
Playground calls from the in-dashboard tool tester don't count either. Those are for debugging, not production usage.
The classifier that makes this decision is one function with a handful of branches. Every code path that dispatches a tool call routes through it, so the meter rules can't drift between the MCP endpoint and the playground.
Why we write synchronously (with a 200ms leash)
The easy architecture for something like this is "fire and forget through a queue." Tool call finishes, push an event onto a Redis list, have a worker drain it into Postgres.
We didn't do that.
The reason is blast radius. Redis down means events silently lost. A worker lag spike means the dashboard shows stale data five minutes after a call. And every event pipeline eventually develops a dead-letter queue that someone has to babysit.
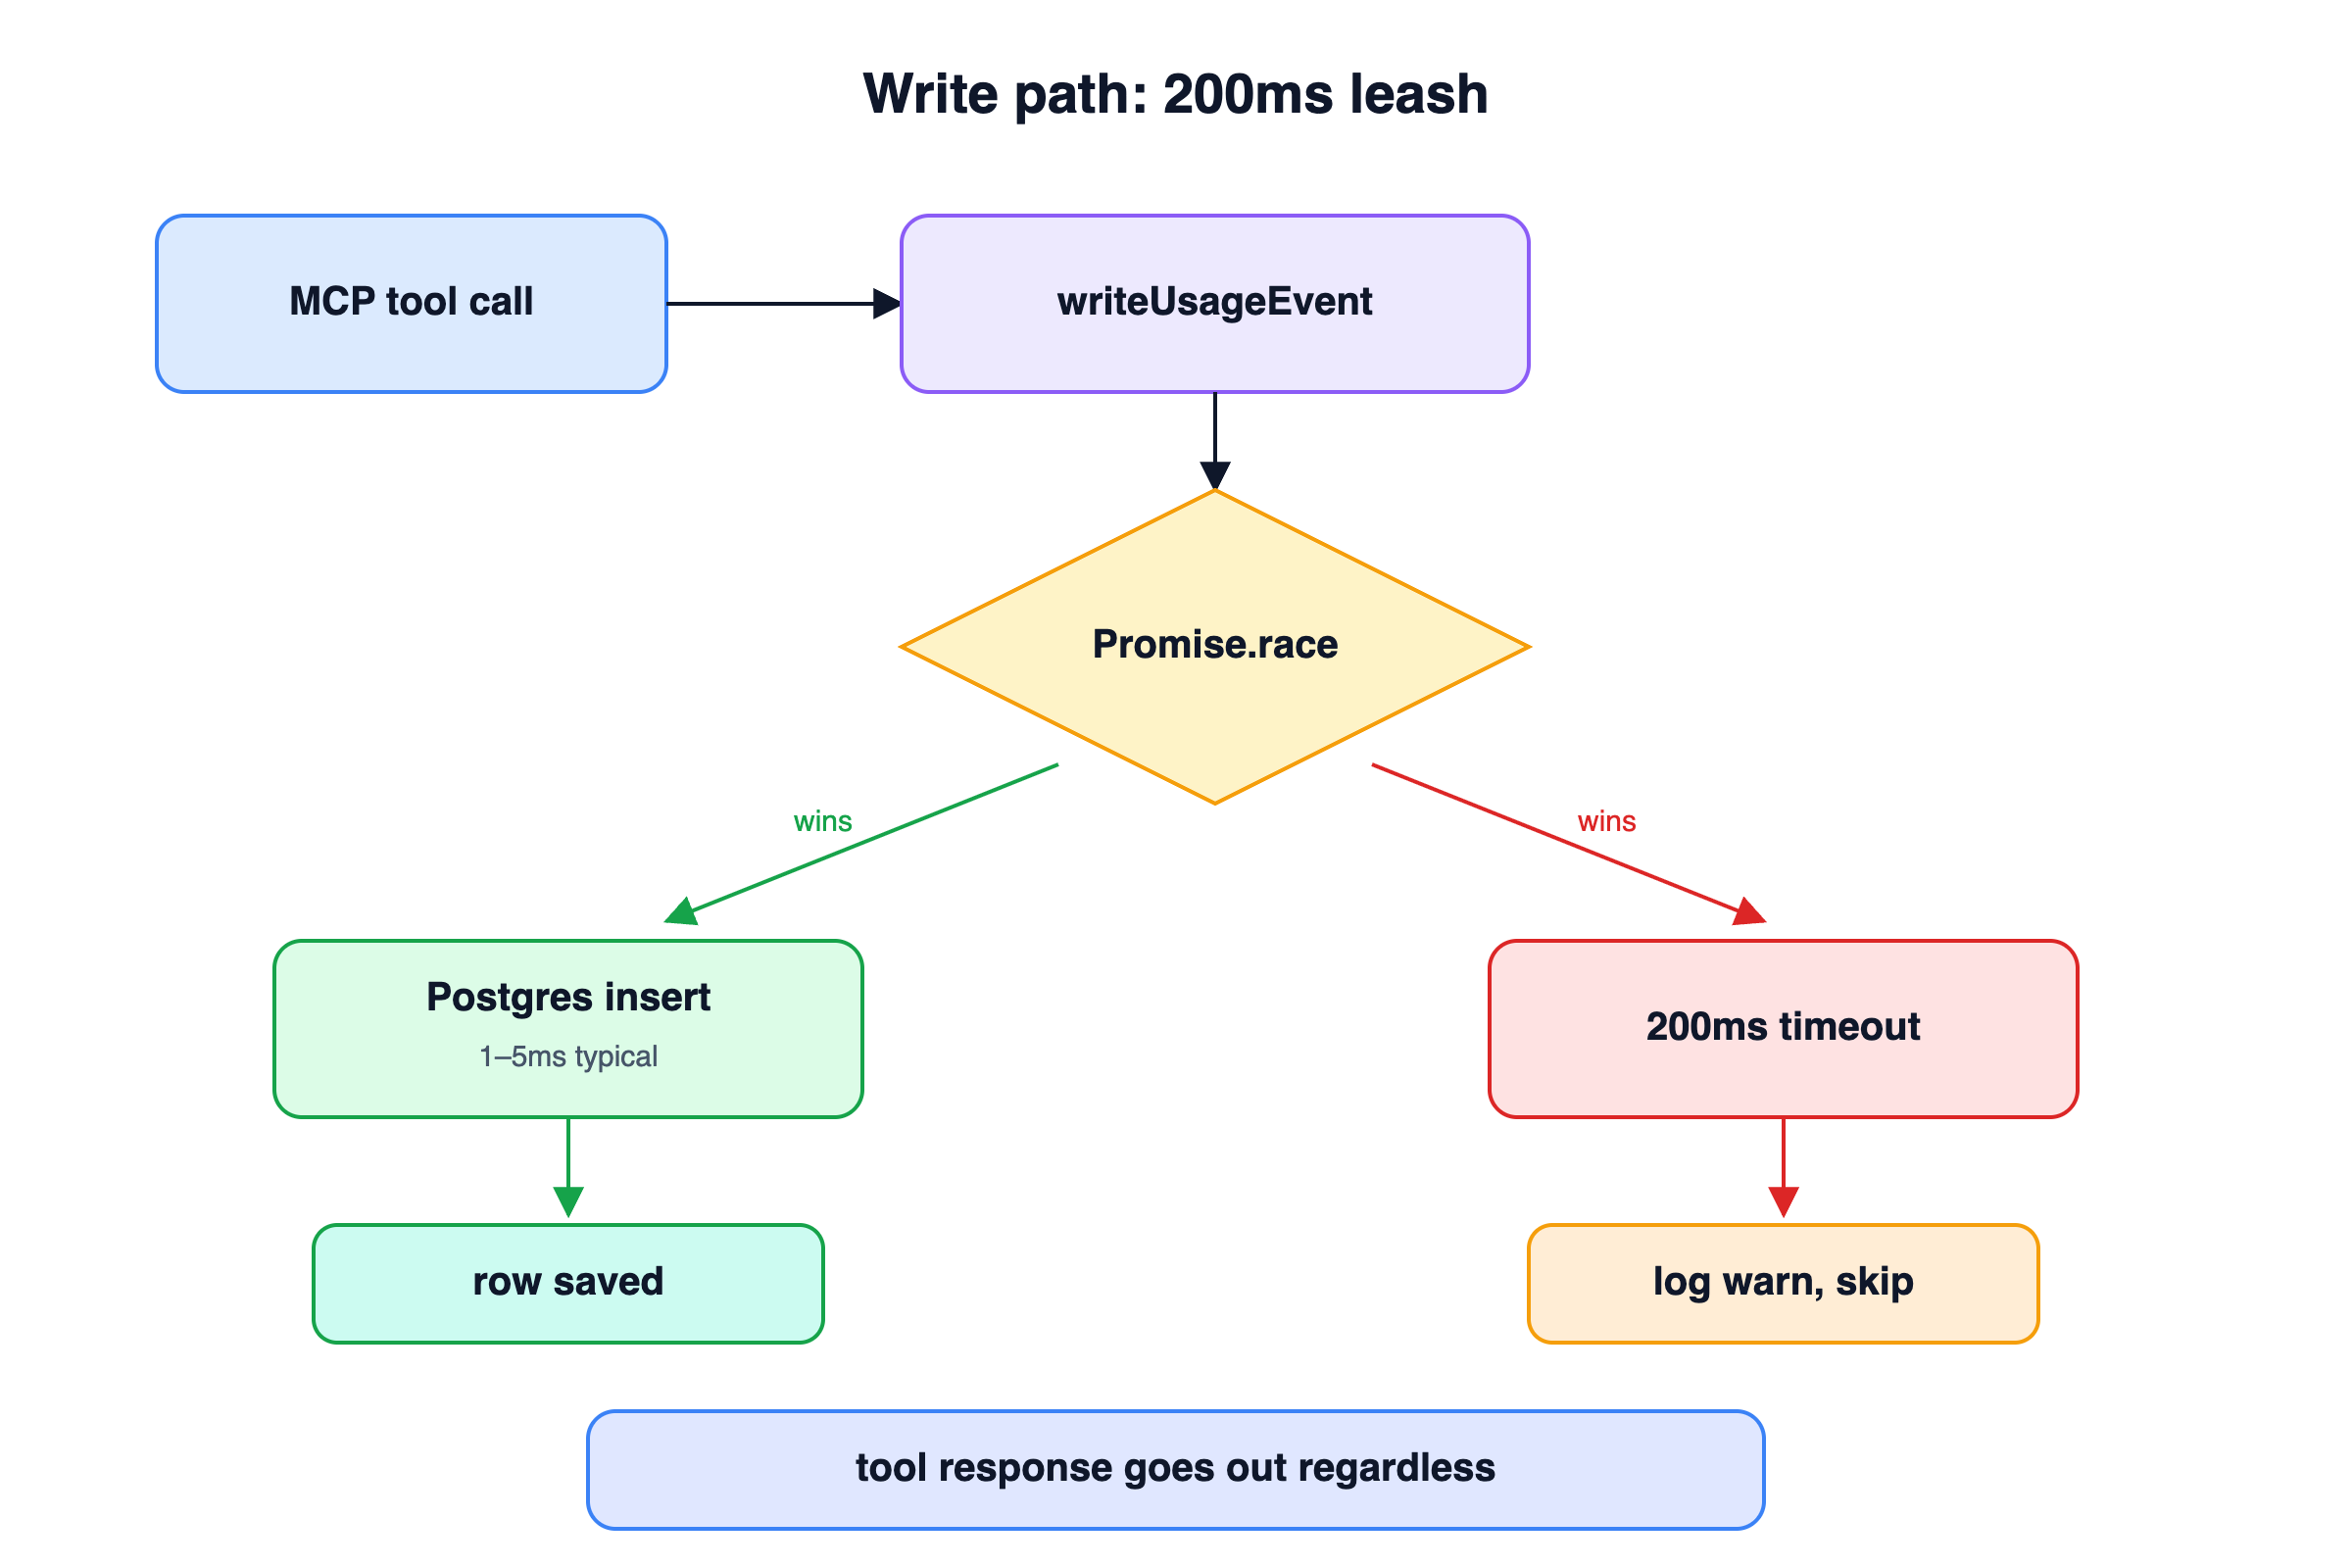
Instead, writeUsageEvent runs inline with the tool-call response path, wrapped in a Promise.race with a 200ms timeout. If Postgres is healthy (the common case), the insert finishes in a millisecond and the response flows through. If Postgres is wedged, the insert loses the race, we log a warning, and the tool-call response goes out anyway. The user gets their tool result. The metric is the thing that drops, not the call itself.
This works because the write is small and indexed, and because we're willing to accept "some events missed during an outage" in exchange for "dashboard is always real-time during normal operation."
Daily rollups and 90-day retention
Raw events are expensive to keep forever, and nobody needs per-call detail for a call that happened four months ago.
Every night at 02:00 UTC, a node-cron job runs:
INSERT INTO usage_events_daily (day, user_id, tool_name, ...)
SELECT yesterday, user_id, tool_name,
       count(*),
       count(*) filter (where status = 'user_error'),
       percentile_cont(0.5) within group (order by latency_ms),
       percentile_cont(0.95) within group (order by latency_ms),
       sum(response_size_bytes)
  FROM usage_events
 WHERE created_at >= yesterday AND created_at < today
 GROUP BY user_id, tool_name, connector
ON CONFLICT (day, user_id, tool_name) DO UPDATE SET ...;

DELETE FROM usage_events WHERE created_at < now() - INTERVAL '90 days';
The rollup is idempotent. If the job runs twice, the ON CONFLICT clause just overwrites. The prune drops anything older than 90 days. The dashboard's 30d and 90d views read from usage_events_daily. The 24h and 7d views read from the raw usage_events table.
We picked node-cron over Postgres's pg_cron extension because the gateway already owns a long-running process. Adding a dependency on a Postgres extension to run one query per day felt like overkill. If the gateway is up, the cron runs. If the gateway is down, nothing is happening anyway and there's no metrics to roll up.
Rate-limiting the dashboard's own APIs
The dashboard has five API endpoints: summary, timeseries, by-tool, by-connector, recent. All of them run Postgres aggregations. All of them are cheap individually, but expensive if someone holds down F5.
We wrapped them in an in-memory sliding-window rate limiter: 120 requests per user per minute, returns a 429 with Retry-After when you blow through it. The limiter is a Map<userId, number[]> where each array holds timestamps of recent requests. Every 5 minutes, a sweep pass evicts empty buckets so the Map doesn't accumulate entries for users who have signed out.
This is deliberately simple. No Redis, no distributed state, no leaky-bucket math. The gateway runs as a single process. If we ever horizontal-scale it, we'll revisit. For now, in-memory is fine and the code is 50 lines.
The dashboard itself
The UI is a Next.js server component with a client-side range toggle (24h / 7d / 30d / 90d). When the range changes, it refetches the five endpoints in parallel and updates the cards, chart, breakdown, and table.
Two choices worth naming.
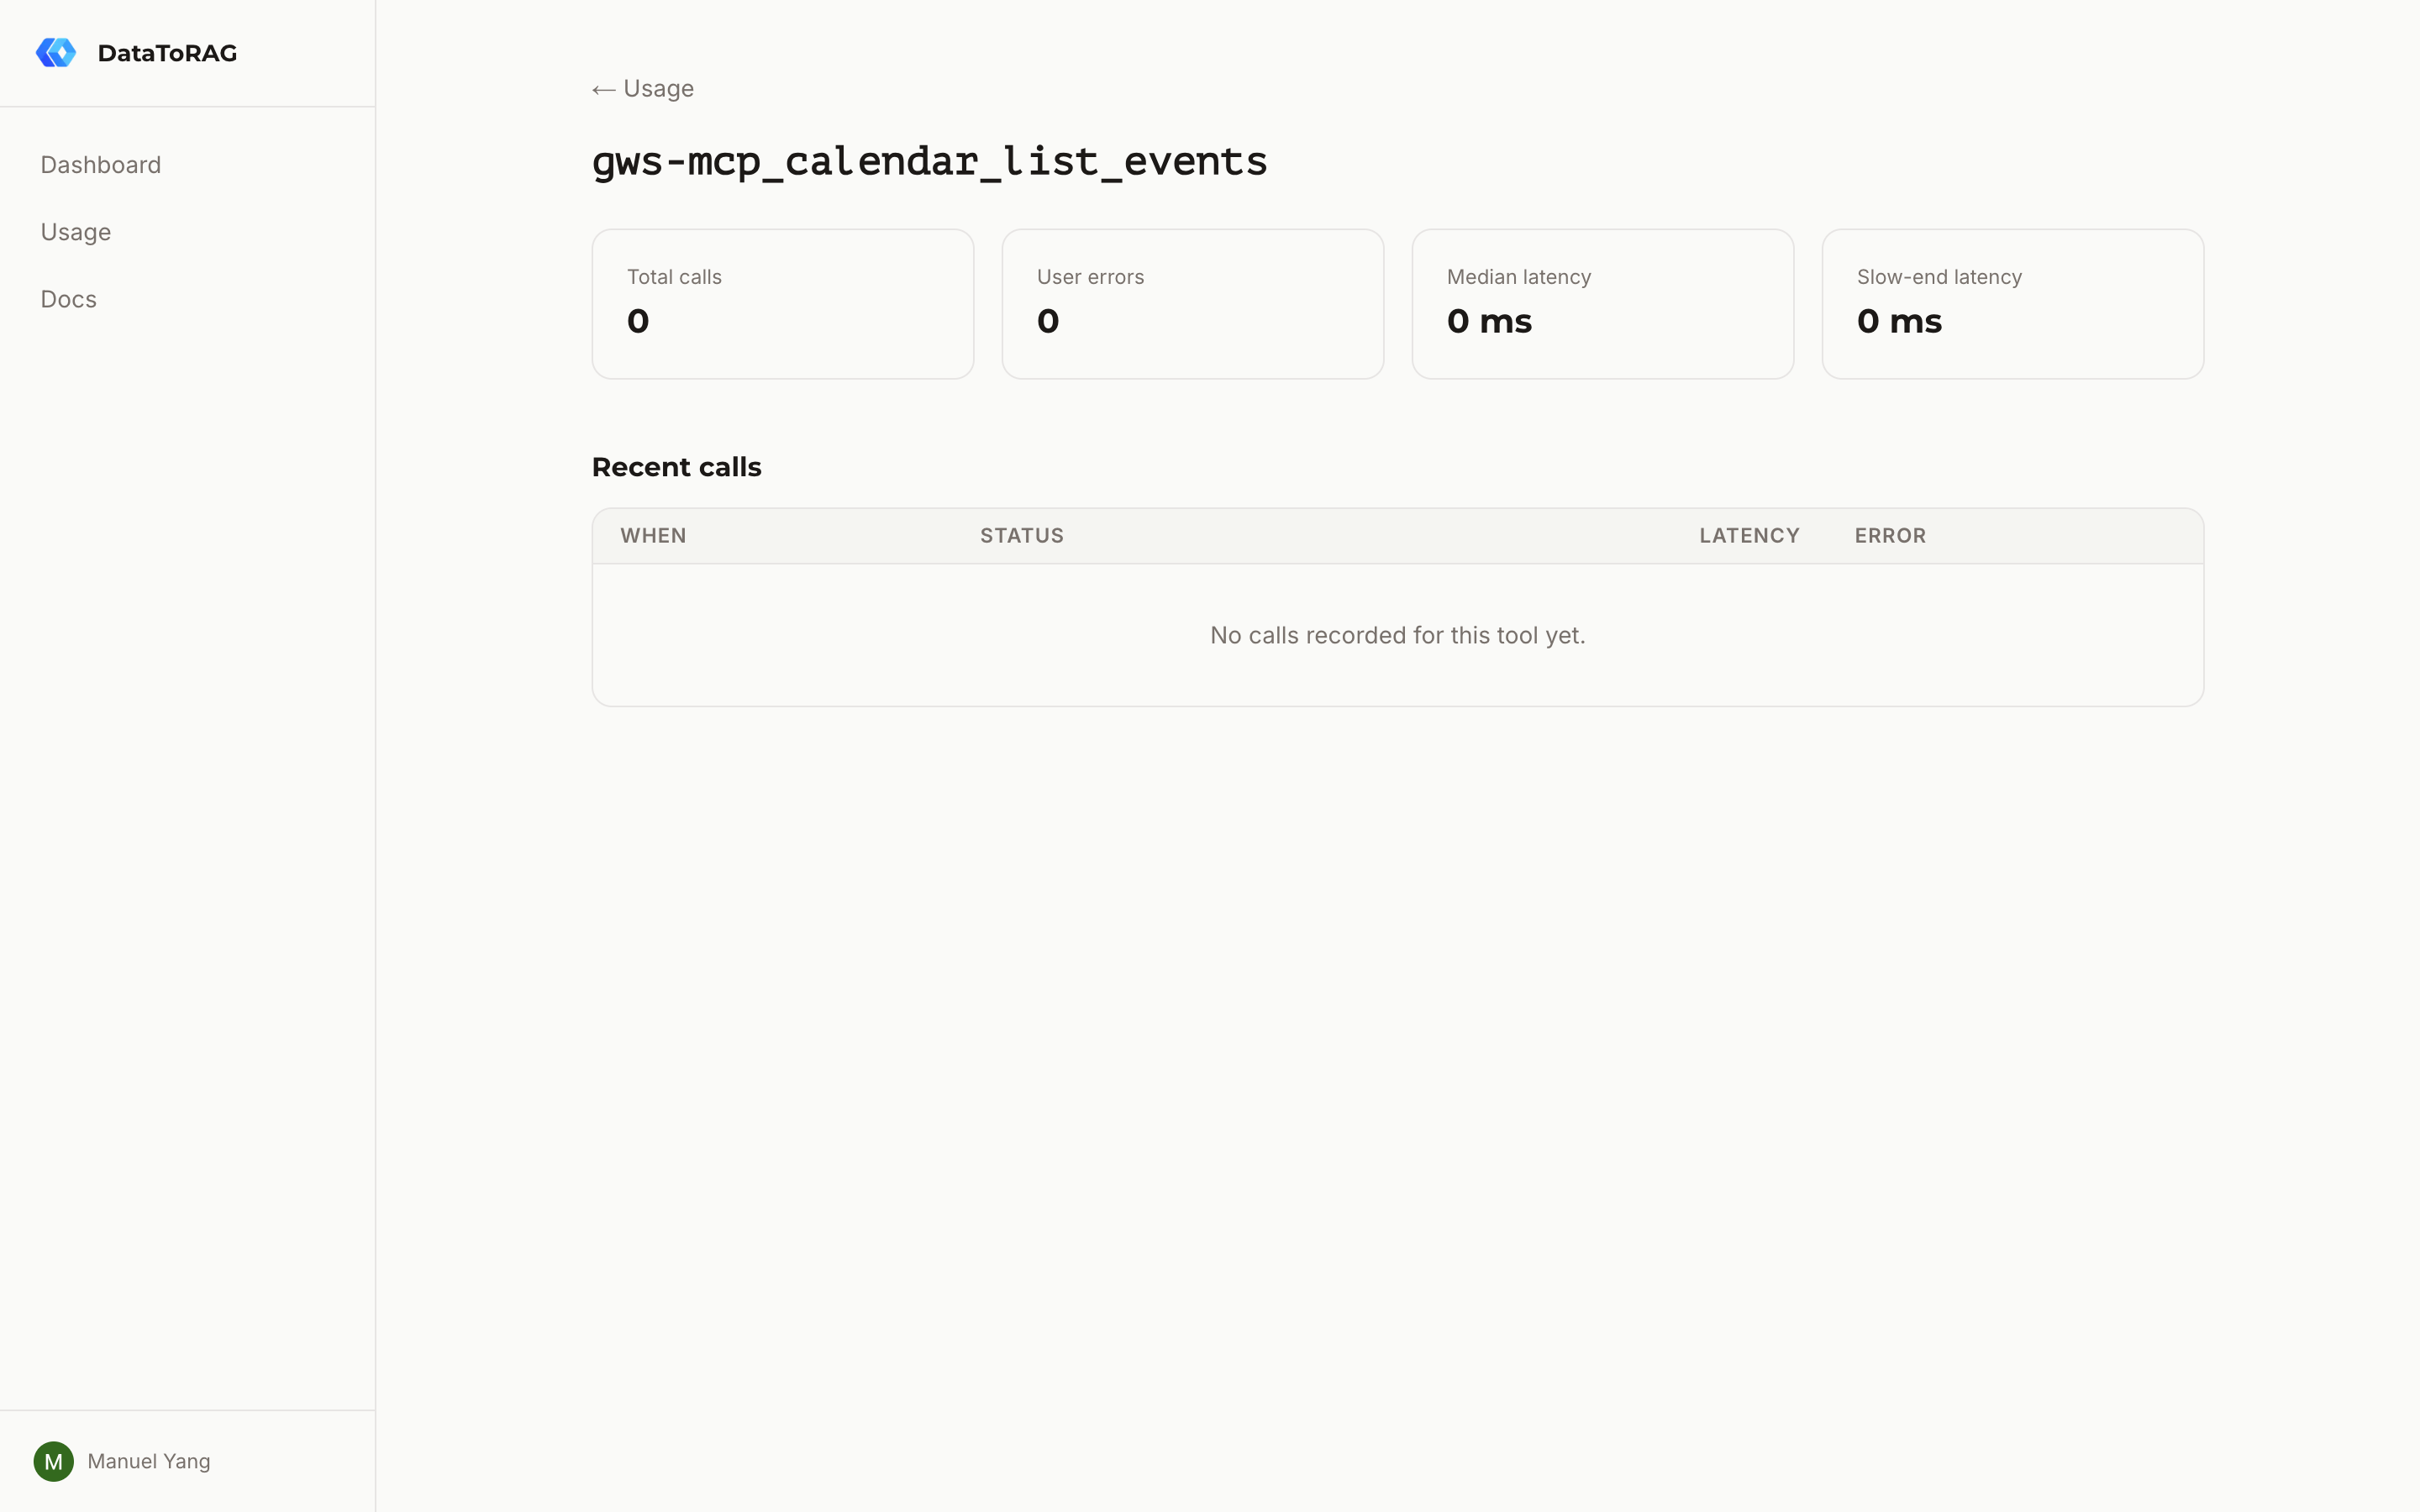
"Median" and "slow-end" instead of "P50" and "P95." Users aren't SREs. "Slow-end latency" tells them "this is the speed you get on a bad day" without requiring them to know what a percentile is. I went back and forth on this one. The instinct when you work on infrastructure is to use the precise term. The instinct is wrong when you're writing UI for people who have better things to do than learn percentiles.
Click a tool row to drill down. The table lists every tool the user has called. Clicking one navigates to /dashboard/usage/[tool] with the last 50 calls and per-tool aggregates. The drill-down is the answer to "what actually broke?" It's where the redacted error messages live.
What it's worth
A usage dashboard in a multi-tenant service isn't a feature. It's a trust signal. The promise is that you can see what your AI assistant is doing without us seeing what you're doing.
We got there by being disciplined about the row schema: tool name, outcome, latency, size, redacted error. Nothing else.
If we ever need to add billing on top of this (metered pricing based on call counts), the meter semantics are already correct. Success and user errors count. Server errors don't. Playground calls don't. The plumbing is the same.
But that's a post for another day.
Related articles
The database changes, token routing, and tool schema tricks behind supporting multiple Google accounts in a single MCP server.
MCP Isn't Dead. You're Just Building for Yourself.The 'just use CLIs' crowd has a point. But it only holds if every user of your tool is a developer with a terminal open.
Claude Can Draft Your Email. It Can't Send It.The native Claude Gmail connector writes drafts into your Drafts folder and stops there. DataToRAG fills the gap: send, reply, forward, label.